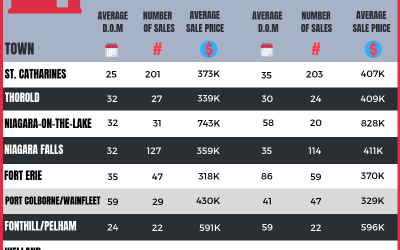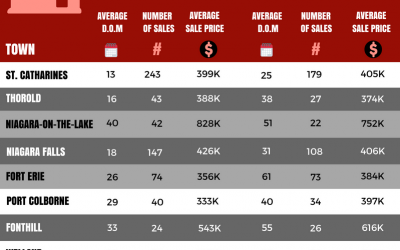
Let's talk about the Real Estate Market! Here are the numbers for July 2018 versus July 2017. What do we see from these numbers? When comparing the numbers of both years for July, we can see a decrease of 5.7% in sales compared to last year. The average days on the...
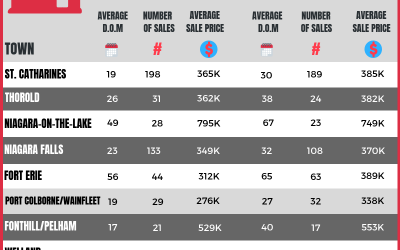
Here are the numbers for June 2018 versus June 2017:
What do these numbers mean? Four things we noticed. There is still a decrease in residential sales compared to June last year, approximately 10.8%. Residential houses are taking 55% longer to sale than June 2017. The residential average sale price had a very marginal...
Market Report May 2018 VS May 2017
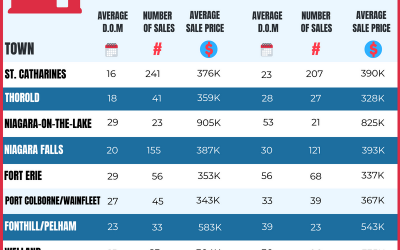
Here are the numbers for May 2018 verses May 2017. What do you see? Last month we saw how the numbers in 2018 are significantly lower than those in 2017. This trend continues through May 2018 VS May 2017. Average Sale Price in 33% of the areas are actually down from...
Market report April 2018 VS April 2017.
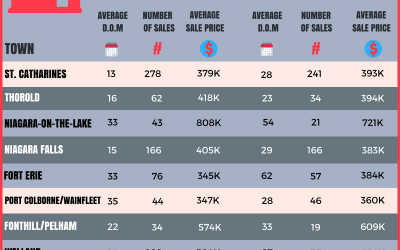
There was a bit of a delay in the monthly stats over the last few months. Data keeps changing constantly and we wanted a fresh look to the Salisbury Stats page. Here is a look at April 2018 versus April 2017. Notice a trend? Average Sale Price in 30% of the areas are...